UK Used Automotive Parts Market Intelligence Report: Q3 2025

21 Oct 2025
Executive Summary
The UK used automotive parts market in Q3 2025 shows major supply-demand imbalances that create both challenges and opportunities across the industry. This report examines platform data representing thousands of listings and buyer requests to identify where the market is breaking down and where smart suppliers can step in.
Key Findings:
- Ford Parts Crisis: The Ford Fiesta is the UK's most common car (1.43 million units), yet Ford parts make up only 7.2% of available inventory whilst commanding 44.7% of demand - a 37.6 percentage point gap with demand pressure 3.8x above market average
- Mechanical Component Shortage: Engines comprise just 2.4% of inventory but account for 14.1% of demand (+11.7pp gap), with individual units commanding prices up to £7,495 reflecting acute scarcity in mission-critical driveline components
- German Marque Oversupply: Mercedes-Benz, BMW, and Audi hold 44.9% of inventory but represent only 34.2% of demand, showing the salvage industry is chasing residual value rather than serving mass-market needs
- Quality Benchmark Established: 99.9% authentication rate for genuine OEM parts at an average listing price of £49.52 positions the premium used parts segment between commodity scrap and new dealer pricing
- Category Imbalances: Car Body Internal parts show 28.1pp oversupply, whilst Accessories (+13.0pp), Engines (+11.7pp), and Suspension (+6.2pp) face acute shortages
Market Implications: There's money on the table for suppliers who can address Ford component scarcity, invest in certified mechanical assembly refurbishment, and pivot away from premium German marques towards volume manufacturers and high-demand component categories.
Market Context: The Premium Used Parts Ecosystem Matures
Q3 2025 represents an inflection point for the UK second-hand automotive parts market. The average vehicle age has reached nearly 10 years old¹ whilst annual repair costs average £503 per driver². Demand for quality-assured used components is at an all-time high. Our Q3 platform data shows both remarkable progress in quality assurance and stubborn supply chain friction that will define the next phase of market evolution.
The verification benchmark speaks for itself: 99.9% of all listings successfully authenticated as genuine OEM parts during Q3³. This level of quality assurance positions the premium used market as a legitimate alternative to new parts, where trust commands a pricing premium. The overall average listing price of £49.52 sits in the sweet spot well above commodity scrap pricing but far below new dealer component rates³.
Volume Market Challenge: Ford Parts Supply-Demand Imbalance
Despite Ford's dominance of UK roads (the Fiesta remains the most common vehicle with 1.43 million registered units⁴, followed by the Vauxhall Corsa), Ford parts represented only 7.2% of available inventory whilst commanding 44.7% of Match Me Alert demand. That's a supply-demand gap of +37.6 percentage points, the largest imbalance in the market⁵.
The demand pressure index (DPI) makes this even clearer. Ford's DPI of 384 is nearly four times the baseline⁵, meaning for every Ford part listed, there are nearly four times as many buyers searching compared to the market average. The unmet demand spans engines for Transit Connects, headlights for Fiestas, bumpers and grills for the Focus, and accessories across the range from Mustangs to B-MAXs³.
The practical impact is that repairers maintaining the UK's most common vehicles struggle to source reliable parts. This pushes consumers towards premature vehicle replacement or forces them to accept uncertified aftermarket substitutes when repairs become too difficult or expensive.
Premium Components Challenge: Mechanical Assembly Shortage
Whilst the Ford shortage affects sheer volume, the mechanical components gap is about value and complexity. Engines made up just 2.4% of Q3 inventory but accounted for 14.1% of demand share - an +11.7 percentage point gap⁵. Gearboxes are even scarcer at 1.3% of inventory. The engine category commanded the highest single listing price recorded during Q3: £7,495.00³, reflecting both scarcity and the considerable risk of guaranteeing these complex assemblies.
This scarcity isn't accidental. Certifying major mechanical assemblies is complex and carries liability, so many get scrapped rather than recirculated. When components require extensive non-destructive testing, warranty backing, and guaranteed functionality, salvage operations often find it economically safer to crush them. The result is a high-risk, low-supply environment where demand far outstrips availability.
Detailed Analysis: Component Category Supply-Demand Dynamics
Understanding which component types face shortages versus oversupply exposes the underlying economics of the UK salvage and dismantling industry. The Q3 data shows distinct patterns that reflect both ease of authentication and liability risk.
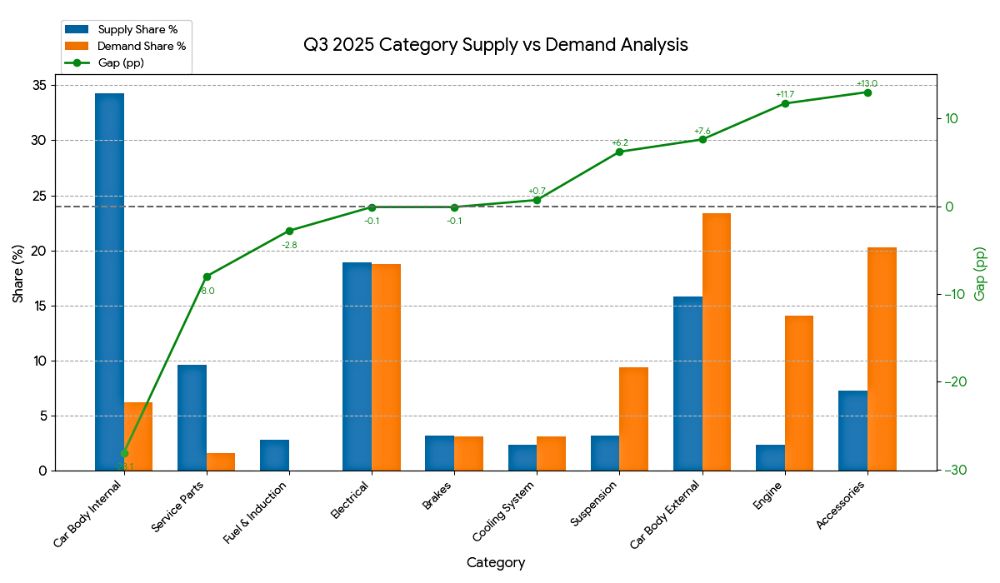
Car Body Internal parts dominated supply at 34.3% of inventory but represented only 6.2% of demand - a -28.1 percentage point oversupply⁵. The economics are straightforward: interior trim pieces and panels are low-risk to authenticate and store, making them attractive to dismantlers even when demand is moderate.
Several categories show acute shortages. Accessories, despite commanding 7.3% of supply, represented 20.3% of demand (+13.0pp gap)⁵. Car Body External components showed similar pressure with 15.8% supply against 23.4% demand (+7.6pp)⁵. Suspension parts, at only 3.2% of inventory, faced 9.4% of demand (+6.2pp gap)⁵, likely driven by MOT failures and safety-critical replacements.
The Electrical parts category looked balanced on paper - 18.9% supply against 18.8% demand⁵ - but this masks regional and model-specific shortages, particularly for ECUs and sensors on volume vehicles where inventory depth hasn't caught up with breadth.
Q3 2025 Category Supply vs Demand Analysis
|
Category |
Supply Share % |
Demand Share % (approx) |
Gap (pp) |
|---|---|---|---|
|
Car Body Internal |
34.3 |
6.2 |
-28.1 |
|
Electrical |
18.9 |
18.8 |
-0.1 |
|
Car Body External |
15.8 |
23.4 |
+7.6 |
|
Service Parts |
9.6 |
1.6 |
-8.0 |
|
Accessories |
7.3 |
20.3 |
+13.0 |
|
Brakes |
3.2 |
3.1 |
-0.1 |
|
Suspension |
3.2 |
9.4 |
+6.2 |
|
Fuel & Induction |
2.8 |
0.0 |
-2.8 |
|
Cooling System |
2.4 |
3.1 |
+0.7 |
|
Engine |
2.4 |
14.1 |
+11.7 |
Supply = Q3 category share of active listings | Demand (approx) = share of Q3 alerts mentioning the category or typical part terms | Gap (pp) = Demand − Supply
Manufacturer Analysis: The German Prestige Paradox and Volume Brand Gaps
Looking at manufacturers rather than components reveals another mismatch. The UK salvage industry's acquisition priorities don't line up with the national vehicle parc composition, creating systematic gaps in parts availability for the most common vehicles.
Mercedes-Benz, BMW, and Audi collectively held 44.9% of Q3 inventory (19.4%, 16.3%, and 9.2% respectively)³, yet their combined demand share was just 34.2%⁵. The supply-heavy positioning is pure economics: premium German marques retain high residual part values, making detailed dismantling and authentication financially worthwhile.
Mercedes-Benz shows the clearest oversupply with a -8.9 percentage point gap and a DPI of just 33⁵—meaning demand pressure is two-thirds below the market average. BMW follows a similar pattern (-3.1pp gap, DPI 50)⁵, whilst Audi shows modest demand-side pressure (+1.3pp gap, DPI 70)⁵.
The supply stream is optimised for residual value extraction from higher-end salvaged vehicles rather than servicing the maintenance needs of the UK's mass-market fleet. The profit-driven focus on German prestige marques directly causes the supply gaps we see in volume brands.
Q3 2025 Brand Supply vs Demand Analysis
|
Brand |
SoS % |
SoD % (approx) |
Gap (pp) |
DPI (Index=100) |
|---|---|---|---|---|
|
Ford |
7.2 |
44.7 |
+37.6 |
384 |
|
Audi |
9.2 |
10.5 |
+1.3 |
70 |
|
Hyundai |
7.9 |
7.9 |
-0.0 |
61 |
|
Land Rover |
8.2 |
7.9 |
-0.3 |
59 |
|
Volvo |
7.6 |
5.3 |
-2.4 |
42 |
|
BMW |
16.3 |
13.2 |
-3.1 |
50 |
|
Mitsubishi |
7.4 |
0.0 |
-7.4 |
0 |
|
Kia |
8.2 |
0.0 |
-8.2 |
0 |
|
Jeep |
8.5 |
0.0 |
-8.5 |
0 |
|
Mercedes-Benz |
19.4 |
10.5 |
-8.9 |
33 |
SoS = supply share (Q3 listings) | SoD = demand share (Q3 alerts) | Gap (pp) = SoD − SoS (positive = demand-heavy; negative = supply-heavy) | DPI = alerts per 1k listings, normalized to Index = 100 (higher = tighter demand pressure)
Emerging Trends: Asian and Korean Manufacturer Parts Demand
Beyond the immediate Ford imbalance and German marque oversupply, Q3 data shows growing friction around Asian and Korean manufacturers - a trend that will intensify as these vehicles age into the second-hand parts market cycle.
Hyundai, Kia, and Mitsubishi collectively represented 23.5% of Q3 inventory but showed varied demand patterns. Hyundai looked balanced (7.9% supply, 7.9% demand, DPI 61)⁵, whilst Kia and Mitsubishi showed zero recorded demand share in the keyword analysis, though this reflects measurement limitations rather than absence of actual buyer interest.
The broader pattern matters. Models like the Kia Sportage and Hyundai Tucson consistently rank amongst the UK's top ten best-selling new cars in 2025⁶, yet Match Me Alerts captured persistent searches for Honda Civics, Nissan Figaros, and Toyota Yaris components³. There are structural hurdles in integrating Asian vehicle salvage into the mainstream UK parts ecosystem, possibly due to complex logistics chains or differences in parts standardisation compared to traditional European models.
Successfully stocking certified parts for these manufacturers isn't optional—it's essential for future-proofing the secondary market as the UK vehicle parc continues to modernise and shift towards Asian and Korean brands.
Niche Segment Analysis: The Heritage and Classic Vehicle Parts Market
Whilst volume manufacturers present supply challenges affecting everyday motorists, the demand for classic and specialised vehicle parts highlights a resilient, high-value niche that operates under different economic principles.
Q3 Match Me Alerts included requests for Jaguar Mark 2s, Morgan 4/4s, Subaru BRATs, Renault 5s, BMW E46s, and Mercedes-Benz R129 SL-Class and W208 CLK-Class components³. These often target decade-old, economically unfeasible-to-remanufacture components such as climate control units for first-generation Subaru BRATs, that rely exclusively on the secondary market for vehicle preservation.
This segment requires specialised, potentially international sourcing that bypasses typical volume salvage operations. Heritage parts command premium pricing due to rarity, and buyers in this segment prioritise authenticity and provenance over price. The high-margin opportunities here reward suppliers with deep technical knowledge, international sourcing networks, and patience for longer inventory cycles.
Market Opportunities: Where the UK Parts Industry Should Focus
The Q3 data points to three clear opportunity areas where supply and demand are fundamentally misaligned, presenting real commercial potential for parts suppliers, dismantlers, and marketplace operators.
The Ford Opportunity: Servicing Britain's Most Common Cars
With a 37.6 percentage point demand gap and a DPI of 384⁵, Ford represents the single largest unmet need in the UK second-hand parts market. There's enormous commercial potential for suppliers who can reliably source Fiesta and Focus components across all categories, particularly electrical systems, body external parts, and engine assemblies. Any business that solves the Ford supply shortage will immediately capture demand from millions of UK motorists maintaining the nation's most common vehicles. That's a considerable competitive advantage over traditional salvage operations that continue prioritising German premium marques.
The Mechanical Components Challenge: High-Value, High-Margin Potential
The £7,495.00 price ceiling on engines and the +11.7 percentage point demand gap show both the commercial opportunity and the technical barrier³,⁵. The market needs suppliers who can provide certified engines, gearboxes, and complex assemblies with proper refurbishment, non-destructive testing, and warranty backing. Businesses that invest in the infrastructure to de-risk these high-value transactions will unlock the most profitable segment of the used parts market, where current scarcity creates premium pricing and minimal competition.
Rebalancing Supply: Moving Beyond German Prestige
Mercedes-Benz, BMW, and Audi show consistent oversupply patterns (negative demand gaps, low DPIs)⁵, confirming the UK salvage industry has optimised for residual value extraction from premium vehicles rather than volume-market servicing. The opportunity lies in rebalancing acquisition strategies towards Ford, emerging Asian manufacturers, and high-demand categories like Accessories, Car Body External, Suspension, and Engines. Suppliers using demand intelligence systems to inform sourcing decisions gain a structural advantage over competitors relying on traditional inventory management approaches.
Industry Standards: Quality Benchmarks and the Premium Used Market Segment
The Q3 data shows that quality assurance is not merely an operational requirement but a fundamental market differentiator that enables premium pricing and buyer confidence in the used parts sector.
The 99.9% authentication rate for genuine OEM parts³ establishes a benchmark that separates the premium used market from traditional, unregulated salvage operations. This verification standard supports the average listing price of £49.52³ which is well above commodity scrap pricing but far below new dealer component rates. This pricing creates a value proposition that traditional salvage yards cannot match through lower quality alone, whilst new parts suppliers cannot compete on price.
The future of the UK used parts market will be shaped by certified trust rather than listing volume alone. Businesses that extend quality assurance protocols to the most complex, high-value components, particularly engines, gearboxes, and mission-critical assemblies, will capture the premium segments where scarcity currently constrains supply and sustains high margins.
The Q3 data has shown exactly where market friction exists. Success in this market requires systematically addressing these imbalances through targeted sourcing, quality infrastructure investment, and demand-responsive inventory strategies.
References
- RAC. (2025). Unplanned repairs leave drivers without cars for days. Retrieved from https://www.rac.co.uk/drive/news/motoring-news/unplanned-repairs-leave-drivers-without-cars-for-days/
- NimbleFins. (2024). Average Cost to Run a Car UK. Retrieved from https://www.nimblefins.co.uk/cheap-car-insurance/average-cost-run-car-uk
- ifndautoparts proprietary platform operations Q3 2025 (Inventory, Pricing, and Match Me Alert System Data)
- SMMT. (2024). British motor parc grew to record levels in 2024 as Fiesta remained most common car. Car Dealer Magazine. Retrieved from https://cardealermagazine.co.uk/british-motor-parc-grew-to-record-levels-in-2024-as-fiesta-remained-most-common-car-smmt/314319
- ifndautoparts Q3 2025 Category Supply vs Demand Analysis and Brand Supply vs Demand Analysis (internal tables)
- RAC. (2025). The top 10 most popular cars in the UK. Retrieved from https://www.rac.co.uk/drive/advice/buying-and-selling-guides/the-top-10-most-popular-cars-in-the-uk/
21 Oct 2025
Tags
Tags